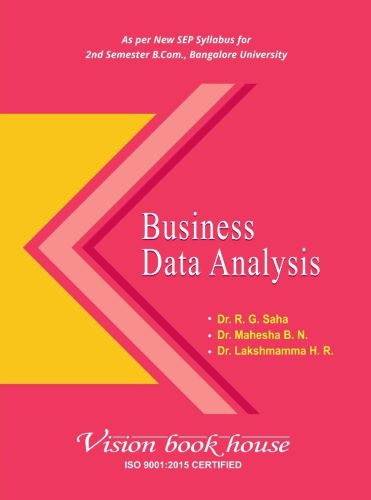
We have great pleasure in presenting First edition “Business Data Analysis” written for students of UG courses. The related matters are written in a simple and easily understandable.
This volume is an attempt to pro vide the students with thorough understanding of Business Data Analysis. We have presented the subject matter in a systematic manner with liberal use of charts and diagrams where ever necessary so as to make it interesting and sustain students’ interest.
Contents –
Module – 1 Introduction to Statistics
Introduction to Statistics
Introduction
Meaning of Statistics
Definitions of Statistics
Features of Statistics
Objectives of Statistics
Functions of Statistics
Importance of Statistics
Limitations of Statistics
Important Terminologies in Statistics
Data
Raw Data
Primary Data
Secondary Data
Population
Census
Survey
Sample Survey
Sampling
Parameter
Unit
Variable
Attribute
Frequency
Seriation
Individual Series
Discrete Series
Continuous Series
Classification
Classification of Data
Requisites of Good Classification of Data
Types of Classification
Quantitative and Qualitative Classification
Review Questions
Practical Problems with Answer
Module – 2 Tabulation and Presentation of Data
Tabulation and Presentation
Introduction
Presentation of Data
Types of Presentation
Textual Presentation
Tabular Presentation
One-way Table
Important Terminologies
Variable
Quantitative Variable
Qualitative Variable
Discrete Variable
Continuous Variable
Dependent Variable
Independent Variable
Frequency
Class Interval
Tally Bar
Diagrammatic and Graphical Presentation
Meaning of Diagrams
Meaning of Graphs
Rules for Construction of Diagrams
Rules for Construction of Graphs
Types of Diagrams
One Dimensional Simple Bar Diagram
Sub-divided Bar Diagram
Multiple Bar Diagram
Percentage Bar Diagram
Two-Dimensional Diagram
Pie Chart
Review Questions
Practical Problems with Answer
Module – 3 Measures of Central Tendency & Dispersion
Measures of Central Tendency
Introduction
Meaning of Measures of Tendency
Objectives of Measures of Tendency
Mean, Median & Mode
Average
Requisites of an Ideal Average
Types of Averages
Arithmetic Mean
Median
Mode
Empirical Relation between Mean, Median & Mode
Graphical Representation of Median & Mode
Ogive Curves
Histogram
Measures of Dispersion
Meaning of Dispersion
Standard Deviation
Co-efficient of Variation
Review Questions
Practical Problems with Answer
Module – 4 Correlation & Regression Analysis
Correlation Analysis
Introduction
Correlation Analysis
Meaning of Correlation
Definition of Correlation
Uses of Correlation
Types of Correlation
Karl Pearson’s Coefficient of Correlation
Probable Error
Spearman’s Rank Correlation Coefficient
Regression Analysis
Meaning of Regression
Uses of Regression
Regression Lines
Regression Equations
Correlation Coefficient through Regression Coefficient
Review Questions
Practical Problems with Answer
Module – 5 Time Series
Introduction
Meaning of Time Series
Uses of Time Series
Components of Time Series
Methods of Trends Value
Method of Moving Averages
Method of Curve Fitting by the Principle of Least Squares
Review Questions
Practical Problems with Answer


